Note: The JS portion of this is probably incorrect with the latest from the 5.0 branch because the way the packages are brought into core changed in r43824. I’ll try to update later today.
In my last post, I wrote about about setting up Chrome debugging for the Gutenberg plugin in VSCode. As of the WordPress 5.0 beta 1 release, that code is now part of WordPress Core, and the plugin is no longer required to use the new block editor.
Development on will continue in the Gutenberg GitHub repo for the various packages now being bundled, but the PHP development going forward will occur in Trac.
To facilitate working on WordPress, I wanted to set up both PHP debugging using xDebug and Javascript debugging using Chrome within VSCode for WordPress-Develop.
Local Environment
There are many different local development options, but in my case, I’m using VVV for WordPress Core development.
I use a customized fork of the custom-site-template-develop config that uses Git to clone WordPress-Develop.
I also have a vvv-custom.yml config that sets up 3 sites. One for standard core development, one for multisite testing, and another just for the Gutenberg plugin that uses the latest stable version of WordPress core.
In VSCode, I have the entire public_html folder added to the workspace.
PHP Debugging
Setting up PHP debugging in VSCode is pretty straightforward—for the most part it “just works”. However, there were a couple of quirks I encountered along the way I had to deal with.
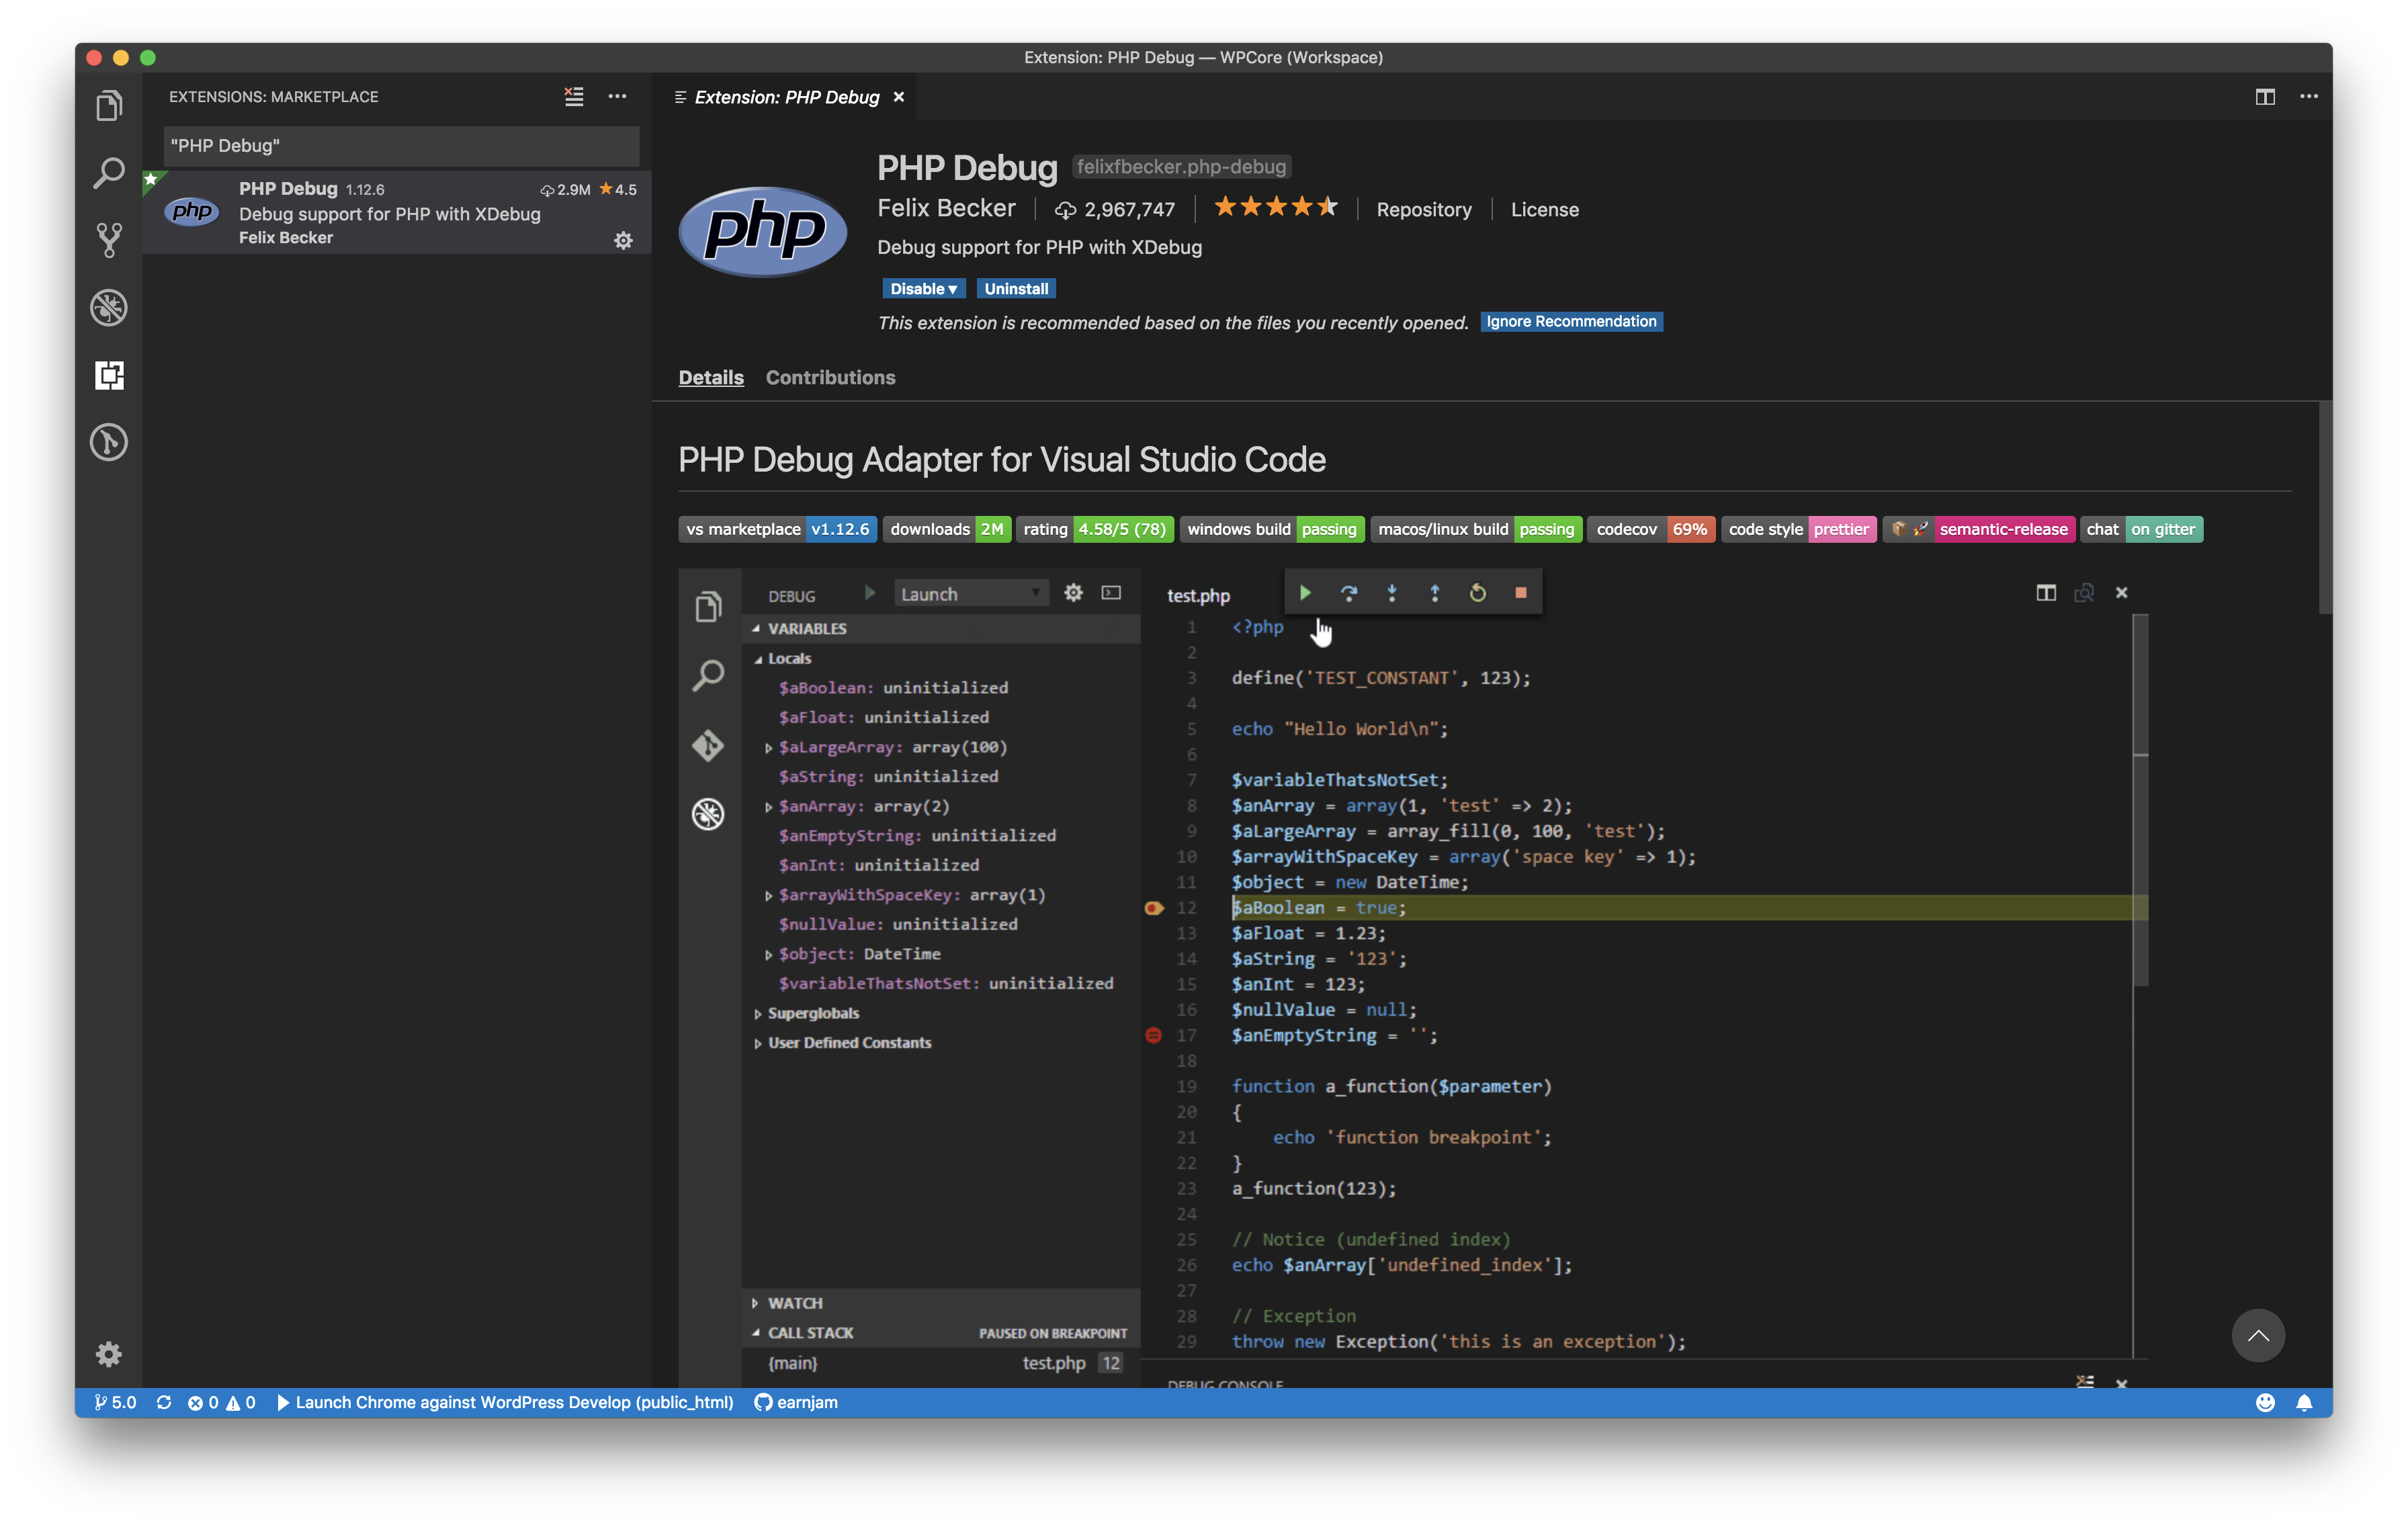
First you’ll need to install the PHP Debug extension from the Extensions Marketplace.
Xdebug Configuration
Second, you will need Xdebug set up on your local environment. Since Xdebug comes installed by default on VVV, all you’ll have to do to get it running is vagrant ssh to connect to the box, then run xdebug_on and it’s up!
If you get an error like xdebug_on: command not found, then run cd /vagrant/config/homebin and then ./xdebug_on and it should work.
After that you should be done with setting up Xdebug. In my case, I had to make one more change because I run VVV under a different IP to make sure it still works when I am connected to my corporate VPN. If you do the same, then you need to make sure your xdebug.ini file is updated with the correct IP for the xdebug.remote_host setting. The default value for this is 192.168.50.1. Since I use 192.0.2.5 for my box IP, I needed to adjust mine to 192.0.2.1.
Change the value for this setting in config/php-config/xdebug.ini within the VVV directory, then run vagrant provision to make sure it is set for all of your PHP versions. You can confirm it was set properly by visiting vvv.test/phpinfo.
VSCode Debug Configuration
Finally, we just need to add our debug config within VSCode. For a standard installation, this is really simple. For WordPress core, we need to add one additional rule.
Open the debugger and click the gear icon at the top. This will create a launch.json file for you with two configurations. We really only care about the first one named “Listen for Xdebug”, since the other is for executing individual PHP files via the command line.
For most WordPress sites, we’d be done here, however because of WordPress Develop’s build method of copying PHP files from the src directory to the build directory and running the site out of there, we need to add a path mapping to the config. This will make it so we don’t have to edit files in the src directory, but set debugging breakpoints in the build directory, and continually jump back and forth.
Our final configuration for Xdebug should look like this:
{
	"type": "php",
	"request": "launch",
	"name": "Listen for Xdebug",
	"port": 9000,
	"pathMappings": {
		"/srv/www/wordpress-develop/public_html/build": "${workspaceFolder}/src"
	}
}Code language: JSON / JSON with Comments (json)
To debug PHP, just choose “Listen for Xdebug” from the debug dropdown and click the green play button. Then make a request to your site. If you’ve set breakpoints in PHP files, they should cause the page to pause and kick you over into VSCode, where you can evaluate variables, view the call stack, etc.
Javascript Debugging
JS debugging is a bit more difficult because we have to tell VSCode where the various original JS files are located for the compiled scripts that are bundled in the final build.
The source maps included with the new Gutenberg packages help with this in those cases, but not all of the other JS files included in WordPress have source maps. Some, like jQuery UI, are unfortunately just external libraries that are minified and then included with no way to debug using the non-minified source.
Chrome Debugger
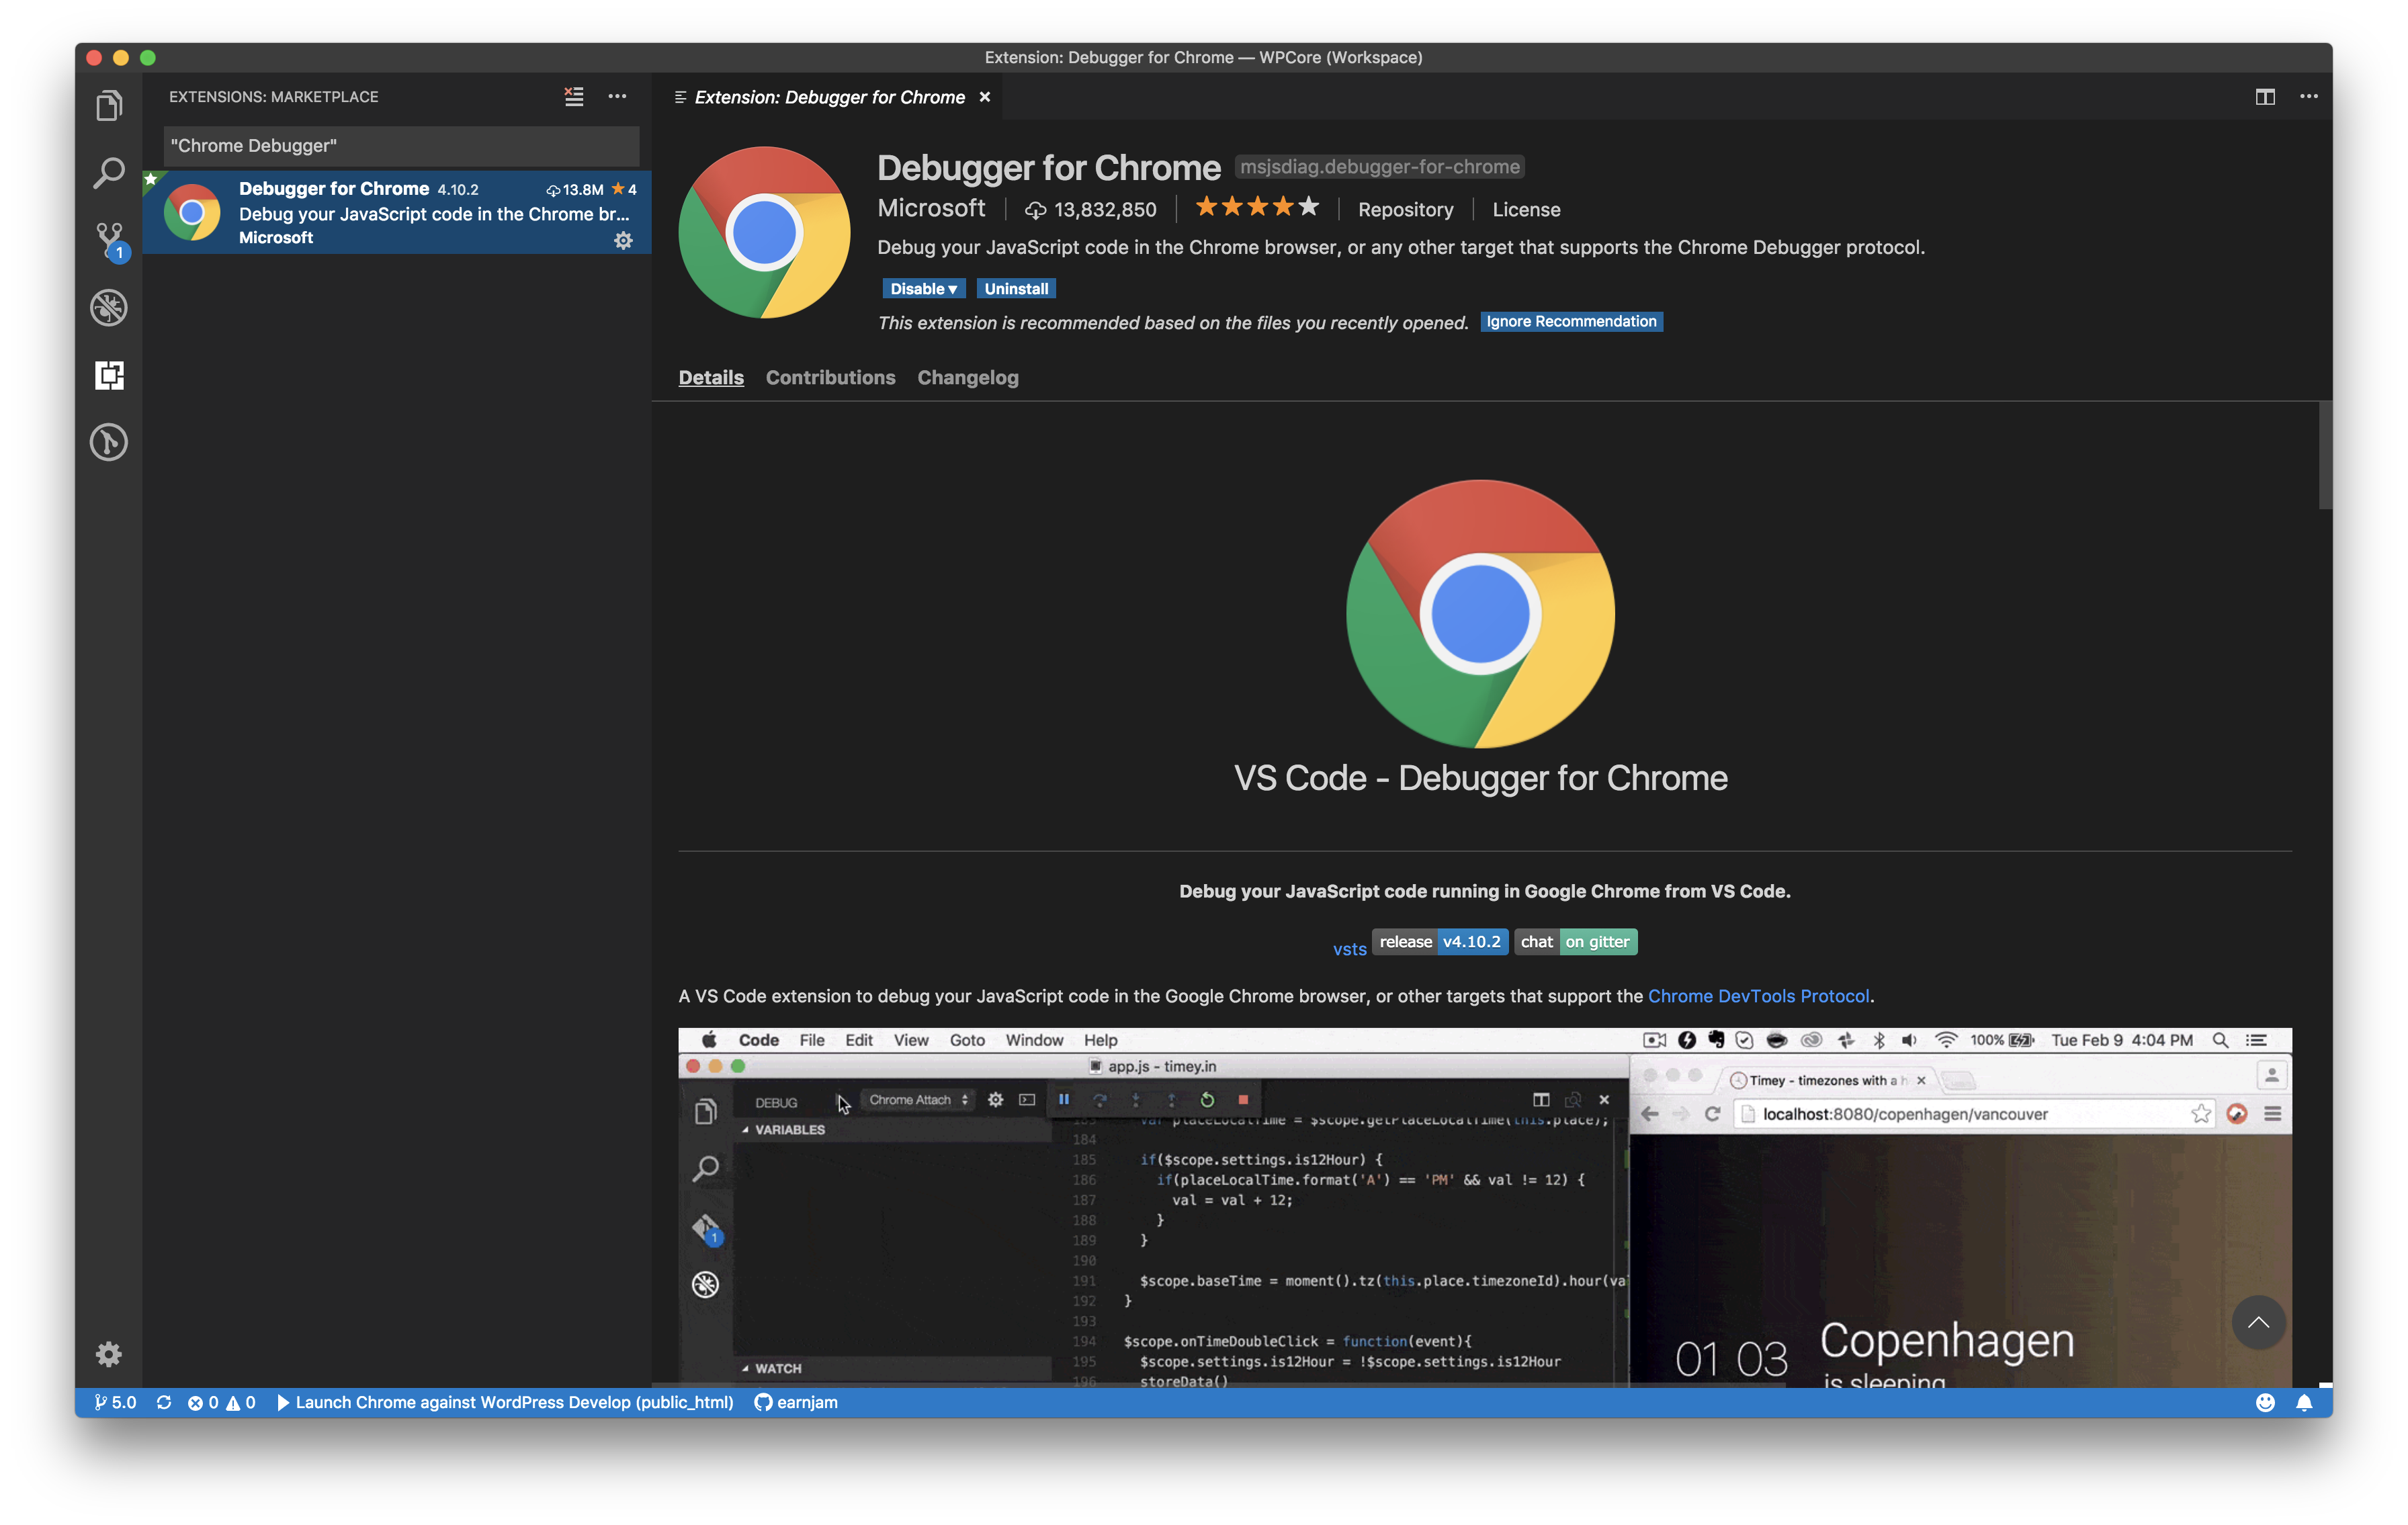
Like with my previous post about debugging for Gutenberg, you should install the Chrome Debugger extension.
In the VSCode debugger, add a new configuration for “Chrome: Launch”.
Change the url parameter to match the URL for your site. I also like to add /wp-admin/ to the end of the URL so that I go directly to the admin.
I deleted the webroot setting that was auto-populated, as I added more specific pathMappings rules. For most of the files, you’ll just want them pointing to src, so you’ll need to add a mapping for "/": "${workspaceFolder}/src".
However, for jQuery UI and the vendor libraries included with Gutenberg (react, lodash, etc) they are simply minified and copied over. There are no source maps generated, so you won’t be able to easily debug within those. Still, it’s helpful to at least map the files properly to prevent the debugger from generating errors while trying to recognize them.
Source Maps
The new Gutenberg JS packages are compiled using webpack and Babel. So the final JS output does not match the original source. The original code is much easier to debug issues with, so webpack generates source maps to let Chrome and debuggers know where the uncompiled code is located. We’ll want to make sure we VSCode understands this too.
While digging into these, I noticed that many of the js files in the packages from Gutenberg in WordPress 5.0 are currently using identifiers that contain paths specific to the users who generated the packages. Ultimately this doesn’t matter except for just needing to make sure we account for each of them. It might get adjusted in a future release, so we’ll just need to keep an eye out for that.
This is the final configuration I ended up with containing all the path mappings and source map path overrides:
{
    "version": "0.2.0",
    "configurations": [
        {
            "type": "php",
            "request": "launch",
            "name": "Listen for xDebug",
            "port": 9000,
            "pathMappings": {
                "/srv/www/wordpress-develop/public_html/build": "${workspaceFolder}/src"
            }
        },
        {
            "type": "chrome",
            "request": "launch",
            "name": "Launch Chrome against WordPress Develop",
            "url": "http://wordpress-develop.test/wp-admin/",
            "pathMapping": {
                "/": "${workspaceFolder}/src",
                "/wp-includes/js/jquery/ui": "${workspaceFolder}/build/wp-includes/js/jquery/ui",
                "/wp-includes/js/dist/vendor": "${workspaceFolder}/build/wp-includes/js/dist/vendor"
            },
            "sourceMaps": true,
            "sourceMapPathOverrides": {
                "${workspaceFolder}/build/": "${workspaceFolder}/src/",
                "webpack://wp.[name]/*": "${workspaceFolder}/*",
                "webpack://wp.[name]//Users/gziolo/PhpstormProjects/gutenberg/packages/*": "${workspaceFolder}/node_modules/@wordpress/*",
                "webpack://wp.[name]//Users/riad/Workspace/a8c/gutenberg/packages/*": "${workspaceFolder}/node_modules/@wordpress/*",
                "webpack://wp.[name]//Users/robert/projects/gutenberg/packages/*": "${workspaceFolder}/node_modules/@wordpress/*",
            }
        }
    ]
}Code language: JSON / JSON with Comments (json)
Once that is set up, you simply Launch the debugger and it will open a Chrome window to your site. Breakpoints should be recognized for most of the JS files within the src directory (except for jQuery UI and the Gutenberg vendor libraries) and the browser console will also log directly into your editor debug console.
Happy debugging!
Thanks for writing this post! Any chance on an update for the docker workflow? If you have docker installed, it’s super easy to set up core from https://github.com/WordPress/wordpress-develop with only these 4 command
npm install
npm run build:dev
npm run env:start
npm run env:install
But I’m having a hard time getting Xdebug to work with docker. Still. Thanks for the post! It’s so hard to find any documentation about this, and Xdebug is such a joy once you get it working 🙂
It’s definitely due for an update!
Just prior to the core Docker environment getting merged, I actually put together a wordpress-develop environment using Docksal that contained XDebug, WPCLI, PHPMyAdmin and Mailhog. It was mostly an excuse to play around with Docksal and learn out how it worked.
https://github.com/earnjam/wpcoredocksal
I haven’t used it in a while, but it should still work. Although the part where I set the site url to be develop.wp caused me some issues periodically and was probably not worth the trouble. Probably should have just left it as the default.
I’ll see if I can work on a new writeup soon about using the built-in dev environment and extending it with XDebug/Mailhog/etc. I’m not using VVV much anymore (actually haven’t set it up on my new machine I got in January). I switch around between Local, Lando and the built-in environments for WP and Gutenberg depending on what I’m working on at any given moment.